Live Data Monitoring Platform — Coastal Buoy
A first-generation coastal sensing platform combining underwater acoustics, motion, temperature and position with local raw-data capture and live cellular monitoring. UCL MEng final design project.
- Embedded Python/C++
- Real-time sensing
- Edge processing
- LTE telemetry
- Store-and-forward
- GNSS
- Hydrophone
Quick summary
- Role
- Software and electronics lead in a five-person team.
- Problem
- Preserve high-bandwidth raw sensing locally while maintaining useful monitoring over an intermittent cellular connection.
- What I built
- Embedded sensing, edge services, local storage, store-and-forward telemetry and the dashboard path.
- Best evidence
- 99.9% field upload delivery; 52 files acknowledged; 226 MB/s measured SSD write speed.
- Main limitation
- Two-hour supervised field window; approximately 23-hour endurance was projected from measured load, not field-tested.
- Repository / report
- View repositoryRead the engineering case study
Overview
This project converted an inherited passive instrument carrier into a working coastal-monitoring prototype. The platform combined an Aquarian H2DM hydrophone, an inertial measurement unit, a water-temperature probe and GNSS with local solid-state storage and a live 4G/LTE dashboard.
The engineering problem was not simply to put sensors in a buoy. The acoustic channel produced far more data than the other instruments, the full raw record had to survive an intermittent network, and the platform still had to remain waterproof, stable, recoverable and light enough for a supervised two-person deployment.
Within a five-person multidisciplinary team, I led the software and electronics. I was responsible for the embedded sensing chain, firmware, data orchestration, local storage, health reporting, 4G/LTE store-and-forward telemetry and the dashboard path. The mechanical, power and structural work was developed with the rest of the team under a total hardware budget of £2,500.
Requirements that shaped the design
Four requirements drove the architecture:
- record the hydrophone continuously at the configured sample format;
- preserve the complete raw record on board;
- transmit position, health and selected summaries to shore during deployment;
- package the system inside a hand-deployable coastal platform.
Those requirements coupled data rate, storage, compute, power, mass and stability. A microcontroller alone did not provide the filesystem, storage interface or network stack needed for the acoustic archive and remote dashboard. A single-board computer alone was less suitable for deterministic low-rate acquisition. The final design therefore split responsibilities between a Raspberry Pi 4B and an Arduino Nano 33 BLE Sense Rev 2.
The cellular connection was treated as intermittent. Raw acoustic and IMU records remained on the Samsung T9 SSD; the LTE link carried position, battery state, system health and selected summaries. Losing the network did not mean losing the measurement.
System architecture
The coastal buoy is an offline-first monitoring system. Physical sensors (hydrophone, IMU, water-temperature probe, GNSS and power monitoring) feed an edge stack: Arduino firmware samples the IMU and streams frames over USB-serial to Raspberry Pi 4 Python services that capture audio, parse GNSS, index files and manage uploads. Data is written to a Samsung T9 SSD and tracked in a local SQLite manifest that records upload and acknowledgement state, so recording continues offline. When a 4G/LTE link is available, telemetry packets and queued files upload to a FastAPI backend that stores relational state in Postgres and acoustic payloads in MinIO or S3-compatible object storage, with shared JSON Schema contracts generating both TypeScript and Python types. The backend acknowledges uploads back to the edge queue, and a Vite/React dashboard reads position, battery, storage, environmental readings, transfer status and alerts. Logging, schema validation, health checks, offline operation and continuous integration are cross-cutting.
The sensing and data path was:
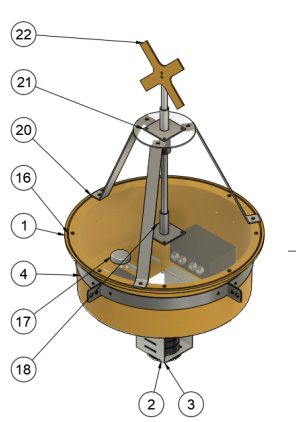
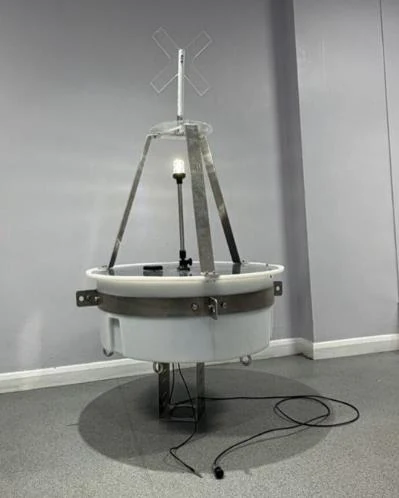
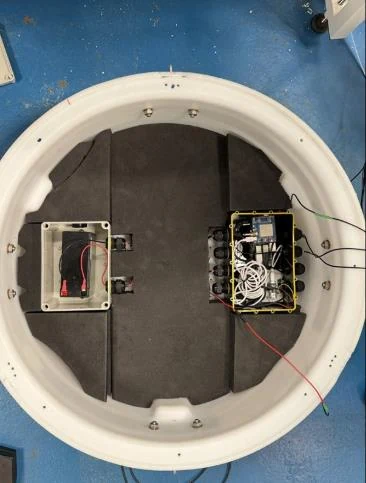
The free-flooded HDPE shell was packed with closed-cell Plastazote LD45 foam. Battery and electronics were mounted low in separate IP68 enclosures. The top structure carried the GNSS/4G puck, daymark and navigation light, while the hydrophone was suspended below the hull.
Mechanical and power trade-offs
The report’s final mass budget placed the unballasted prototype at 23.13 kg. With the maximum 12 kg removable ballast configuration, total mass rose to 35.13 kg and the calculated centre of gravity fell from 0.165 m to 0.041 m above the shell base.
| Configuration | Predicted freeboard | Calculated GM | Positive-stability range |
|---|---|---|---|
| No ballast | 19.1 cm | 0.386 m | 0°–78° |
| Maximum ballast | 16.1 cm | 0.348 m | 0°–133° |
The wide circular waterplane gave strong small-angle stability. Ballast made the buoy much harder to overturn at large angles, but it did not eliminate the stable inverted condition created by the flat upper geometry. A domed or curved top is the clearer route to true self-righting.
Power testing exposed a second system-level trade-off. Active recording averaged 4.27 W on the measured 5 V rail, almost identical to the 4.38 W idle mean. Recording itself was not the dominant incremental cost; keeping the Raspberry Pi and peripherals awake was.
The intended 120 Wh LiFePO₄ pack therefore supported about 23 hours of projected continuous operation at the measured load, not the original 14-day target. Reaching fourteen days would require a much larger energy store or a coordinated redesign involving duty cycling, energy harvesting, hull volume, mass and stability.
Verification ladder
The prototype was not validated with one demonstration. It moved through a staged test ladder.
Results
Bench testing established wide storage margin: the Samsung T9 sustained 226 MB/s, compared with less than 1 MB/s required by the configured acoustic stream. The Raspberry Pi reached a working SSH state in 40 seconds, the temperature probe settled within 0.1 °C of its reference, and GNSS acquired a cold-start 3D fix in 90 seconds.
The IMU result was narrower but still useful. Across T2–T9, detected dominant frequency followed the commanded tank frequency with a mean error of 4.7%; every point remained within 11%. The amplitude-derived heave response showed the expected resonance around 1 Hz, but the report did not have an independent wave-height reference and therefore did not treat it as calibrated absolute heave.


View frequency and heave data table
| Test | Commanded (Hz) | Detected (Hz) | Approx. SNR (dB) | Relative heave |
|---|---|---|---|---|
| T2 | 0.55 | 0.53 | 40.9 | 0.575 |
| T3 | 0.70 | 0.70 | 48.1 | 0.084 |
| T4 | 1.00 | 1.00 | — | 0.321 |
| T5 | 1.15 | 1.07 | 26.9 | 0.081 |
| T6 | 1.30 | 1.17 | 36.1 | 0.019 |
| T7 | 1.45 | 1.30 | 25.5 | 0.006 |
| T8 | 1.70 | 1.60 | 24.9 | 0.006 |
| T9 | 1.00 | 1.00 | 35.8 | 0.766 |
Acoustic result
The wave-tank hydrophone test was designed to determine whether platform motion contaminated the acoustic channel. The controlled wave conditions produced no detectable acoustic signature above the system’s self-noise. That was useful evidence that the tank motion itself was not dominating the recording.
It was not proof of deep-sea acoustic sensitivity. The analogue gain configuration left low-level ambient signals below the digitiser noise floor. The next revision needs greater low-noise gain, careful headroom management and a calibrated acoustic reference.
This distinction matters: the system demonstrated continuous capture and data integrity, while quiet-signal sensitivity remained only partially validated.
Field deployment
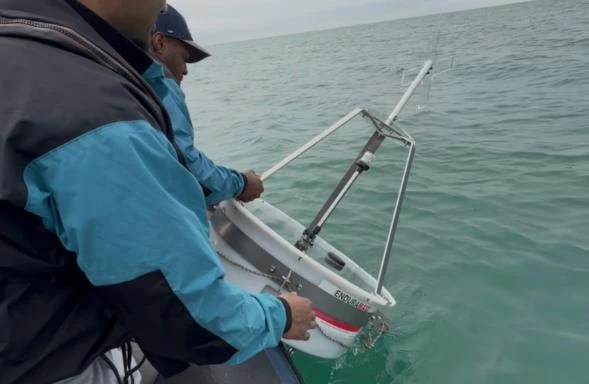
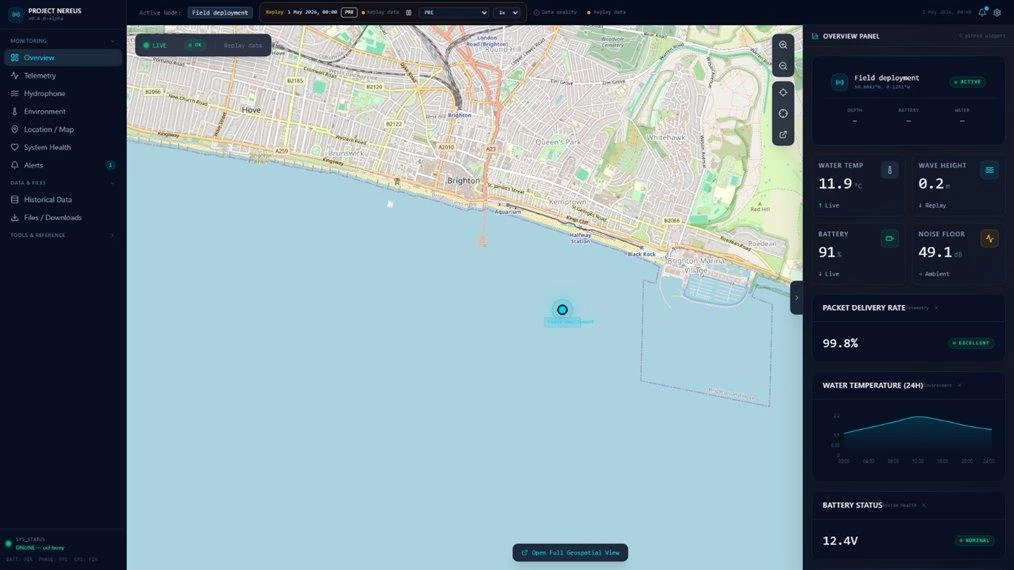
The prototype was deployed from a supported small craft at Brighton on 1 May 2026. It remained upright with positive freeboard throughout the field window, recorded the acoustic stream locally and maintained live position and system reporting over the cellular link.
The full-window telemetry record reported 99.9% upload delivery: 52 files acknowledged and none pending. The 99.8% packet-delivery value visible in the dashboard screenshot is a displayed point-in-time metric, not a replacement for the report’s full deployment result.
What the prototype established
The project established that an open, student-built coastal platform could combine a high-bandwidth acoustic channel with lower-rate motion and environmental sensing, retain the raw record locally and still provide useful remote awareness during deployment.
It did not establish a production-ready oceanographic instrument.
The evidence supports:
- integrated multi-sensor operation;
- continuous local recording during the tested windows;
- storage bandwidth with a very large margin;
- live coastal LTE monitoring;
- useful dominant-frequency recovery from the IMU;
- stable small-angle behaviour and safe supervised deployment;
- a documented handover route for another team.
The evidence does not support:
- fourteen days of unattended endurance;
- calibrated wave height;
- low-level deep-sea ambient acoustic sensitivity;
- self-righting from complete inversion;
- offshore operation beyond cellular coverage.
Redesign priorities
The next version should treat the remaining problems as coupled system changes rather than isolated component swaps:
- add low-noise hydrophone gain and calibrate the full acoustic chain;
- calibrate IMU-derived heave against an independent wave reference and orientation-aware processing;
- replace the flat upper surface with a geometry that removes the stable inverted condition;
- redesign power, hull volume and ballast together for multi-day endurance;
- add automated LTE modem recovery and a low-bandwidth satellite fallback;
- retain the same store-and-forward rule so telemetry failure never destroys the raw record.
Documents
The full public report contains the complete mechanical design, hydrostatic and structural analysis, electronics, software architecture, risk assessment and test evidence. The repository contains the embedded and edge-processing implementation.